Remove visualize
article thumbnail

Streamlining automation with all-in-one control and visualization

Design World

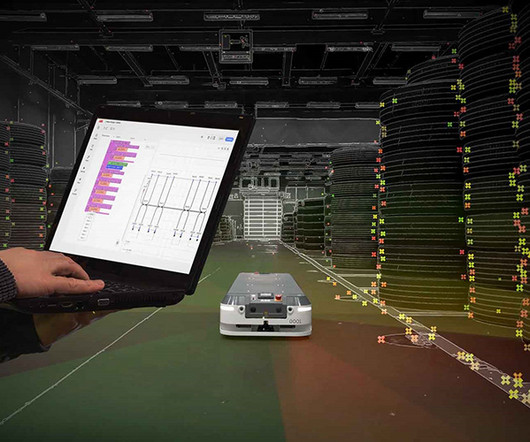
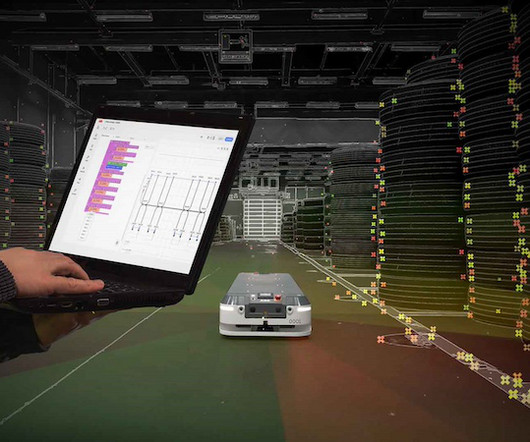
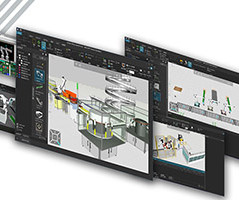
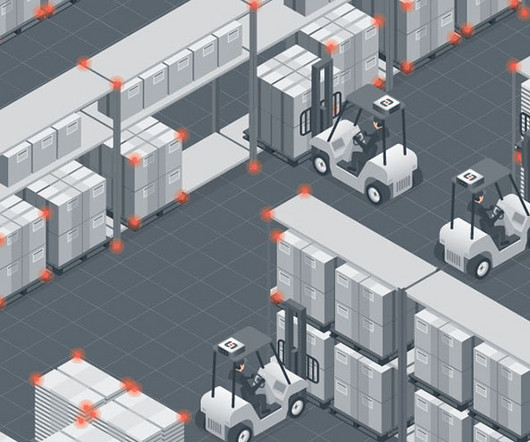
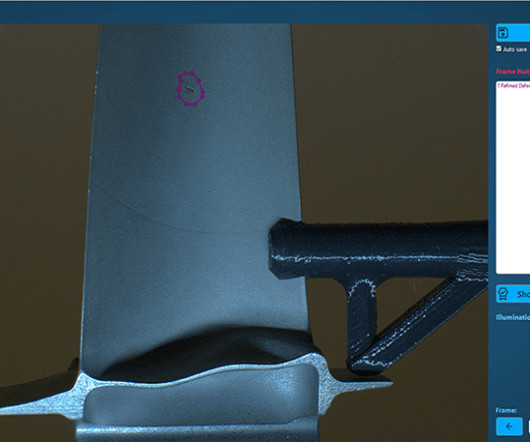
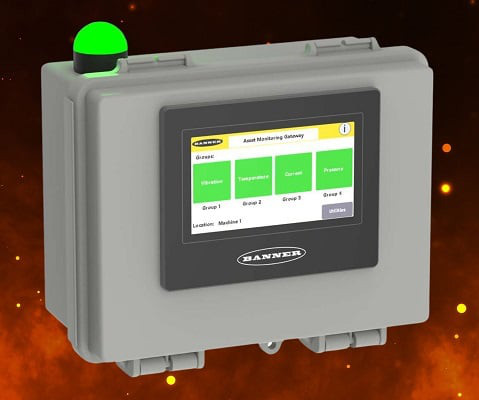
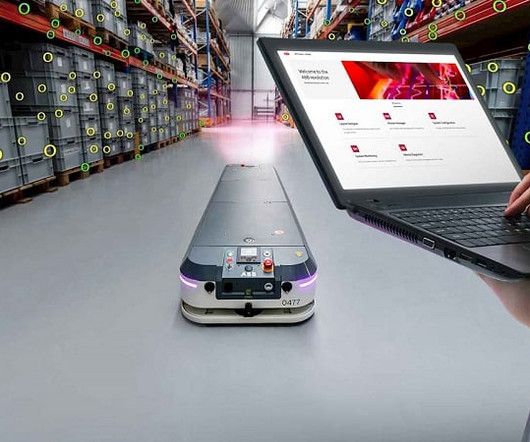
When it comes to industrial automation applications, there has long been a degree of separation between “control” and “visualization” functions. A closer look reveals why this has been the case historically, and it can… The post Streamlining automation with all-in-one control and visualization appeared first on Design World.

article thumbnail

Patlite NE Series visual and audible-visual signaling beacons from AutomationDirect

Design World

AutomationDirect has added Patlite NE series visual and audible-visual signaling beacons to their portfolio of industrial signaling devices. These signaling devices are offered as visual-only beacons or as combination devices with a buzzer or selectable tone alarm (8 different tones) and signal beacon.

130
130
Insiders

Sign Up for our Newsletter

This site is protected by reCAPTCHA and the Google Privacy Policy and Terms of Service apply.

article thumbnail

HMI, Visualization and Industry’s Digital Transformation

Automation World

How the connectivity and extensibility of visualization software and HMI technology is enhanced through the use of open systems that promote collaboration, communication and interaction.

188
188
article thumbnail

ABB unveils mobile robot with Visual SLAM AI-technology and AMR Studio Suite

Design World

· Equipped with Visual SLAM, ABB’s AMR T702 trolley robot offers increased speed, accuracy, and autonomy in navigation and logistics. Intuitive Visual SLAM and user-friendly AMR Studio together can reduce commissioning time by up to 20 percent.…

Robotics 147
article thumbnail

Monetizing Analytics Features: Why Data Visualizations Will Never Be Enough

Think your customers will pay more for data visualizations in your application? But today, dashboards and visualizations have become table stakes. Five years ago they may have. Discover which features will differentiate your application and maximize the ROI of your embedded analytics. Brought to you by Logi Analytics.

article thumbnail

ABB transforms AMR performance with launch of Visual SLAM technology

Design World

· New AI-enabled navigation technology allows AMRs to make intelligent decisions in dynamic and challenging environments · Technology reduces commissioning time by up to 20 percent, requiring less calibration and no change to infrastructure ·Increases flexibility for fast-changing intralogistics requirements in production, logistics, healthcare, and (..)

Logistics 244
article thumbnail

Top 5 AI Background Removers for Stunning Visuals

Robotics Automation News

Revolutionize your visuals with the top 5 AI Background Removers. In the realm of digital visuals, the need for clean and professional-looking images has never been more crucial. The AI background remover emerge as the go-to solution for achieving flawless visuals, […]

111
111
article thumbnail

Monetizing Analytics Features: Why Data Visualization Will Never Be Enough

Think your customers will pay more for data visualizations in your application? But today, dashboards and visualizations have become commonplace. Which analytics features are replacing visualizations as “the next big thing”. Five years ago they may have. You’ll learn: The 3 benefits of deeply embedding BI.

article thumbnail

Monetizing Analytics Features

Think your customers will pay more for data visualizations in your application? But today, dashboards and visualizations have become table stakes. Five years ago, they may have. Turning analytics into a source of revenue means integrating advanced features in unique, hard-to-steal ways.

article thumbnail

Drive Better Decision-Making with Data Storytelling

Storytelling is more than just data visualization. Storytelling provides an organized approach for conveying data insights through visuals and narrative. Data visualization - Visualizations help to effectively tell a data-driven story.

article thumbnail

Embedded Analytics Insights for 2024

Organizations look to embedded analytics to provide greater self-service for users, introduce AI capabilities, offer better insight into data, and provide customizable dashboards that present data in a visually pleasing, easy-to-access format.

article thumbnail

The Definitive Guide to Dashboard Design

That’s one of the many reasons we wrote The Definitive Guide to Dashboard Design—to help you avoid common pitfalls, including… Cramming too much onto one screen and expecting the user to figure out what’s interesting and relevant on their own Getting carried away with fonts and colors so the user is distracted by formatting instead of focusing on the (..)

article thumbnail

How to Build Data Experiences for End Users

Data literate: Users have a comfort level of working with, manipulating, analyzing, and visualizing data. End users fall into 4 different categories along the data literacy continuum when it comes to their skill level with data: Data challenged: Users have no-to-low levels of analytics skills or data access.

article thumbnail

New Study: 2018 State of Embedded Analytics Report

Why do some embedded analytics projects succeed while others fail? We surveyed 500+ application teams embedding analytics to find out which analytics features actually move the needle. Read the 6th annual State of Embedded Analytics Report to discover new best practices. Brought to you by Logi Analytics.

article thumbnail

5 Early Indicators Your Embedded Analytics Will Fail

Many application teams leave embedded analytics to languish until something—an unhappy customer, plummeting revenue, a spike in customer churn—demands change. But by then, it may be too late. In this White Paper, Logi Analytics has identified 5 tell-tale signs your project is moving from “nice to have” to “needed yesterday.".