article thumbnail

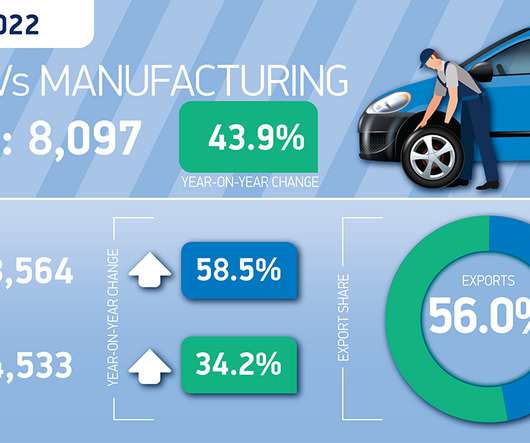
UK commercial vehicle output continues growth with best July for six years

SMMT

since January, at 58,693, the best year to date since 2012. above the pre-pandemic five-year average and the best January to July performance since 2012. CV production January-July 2012: 65,100 units. Overseas demand increases by 34.2%, while production for Britain’s CV market grows by 58.5%. UK manufacturing is up 46.9%

Freight 129
article thumbnail

Logistics and freight transport, a sector in growth with more than 10,000 direct jobs gained in Greater Montreal over the last decade

Canadian Manufacturing

“Although the number of companies in Greater Montreal between 2012 and 2021 decreased from 6,297 to 6,089, the total number of jobs in transportation and warehousing increased by nearly 24 per cent, from 43,700 to 54,100,” said Mathieu Charbonneau, Executive Director, CargoM. billion compared to $4 billion in 2012.

Insiders

Sign Up for our Newsletter

This site is protected by reCAPTCHA and the Google Privacy Policy and Terms of Service apply.

article thumbnail

Australian EV truck manufacturer doubles assembly capacity

AU Manufacturing

Founded in Australia in 2012, SEA Electric released its first electric commercial products in 2017, while last year it launched its new range of medium and heavy-duty electric cab chassis models, distributed and supported by an extensive dealership network. SEA Electric was founded in 2012. three-axle rigid trucks.

article thumbnail

CV manufacturing shows resilience but support needed for ZEV uptake

SMMT

While part of the growth is due to comparison with a highly disrupted August 2021, it was nevertheless the best August 2012, with strong demand for vans, trucks and buses meaning the sector also recorded its best year-to-date performance since 2012, at 64,828 units – some 19.4% higher than the pre-pandemic five-year average.

article thumbnail

Fastener Distributor Index (FDI) | March 2024

Fastener News Desk

Demand commentary leaned overall fairly positive but balanced out by a noticeable uptick in comments regarding continued rises in freight/container costs and labor strikes/delivery issues. Key Takeaway: The seasonally adjusted Fastener Distributor Index (FDI) expanded further in March, increasing to 53.0, up from 50.5 in February.

Freight 52
article thumbnail

Fastener Distributor Index (FDI) | August 2023

Fastener News Desk

per part” and “Inflation is impacting many of the traditional costs of distribution in USA including labor and freight. Product sourcing prices in Taiwan are up 6%, China is slightly down, and containerized freight is down. We have lost orders for less than $0.25 Customers are flat and building to order vs. inventory.”

Freight 52
article thumbnail

Fastener Distributor Index – November 2022

Fastener News Desk

Additionally, supply chain constraints continued to ease, with noticeable improvement in ocean freight times commented on by multiple respondents. The Fastener Distributor Index (FDI) was developed as a service to the fastener industry by the FCH Sourcing Network in 2012 to be a new benchmark for the fastener industry.