No matter if you are a production manager with 10 machines or an executive overseeing multiple plants, knowing how your organization performed yesterday, last month, and last year is of the utmost importance for determining how you are performing today. Data-driven manufacturers can use real-time machine data to easily compare real-time performance with past performance.
Accurate historical production and operational data provide manufacturers with a benchmark to monitor current performance and quickly identify where they are underperforming versus expectations.
MachineMetrics automated benchmarking capabilities provide a statistically sound benchmarking score that companies can use as a guide for truly understanding their performance in context to how they typically perform.
Data used in MachineMetrics’ automated benchmarking include:
- Overall Equipment Effectiveness (OEE)
- Utilization
- Cycle time
- Downtime
Automated Benchmarking with MachineMetrics
Since MachineMetrics can connect to any type of discrete manufacturing equipment, the amount of data collected can be massive. This swath of data can be morphed into a benchmark or baseline for powerful insights across multiple levels and dimensions of the operation.
MachineMetrics calculates the median value for each metric over the last six-month period. It then aggregates the data and calculates the difference between the current and historical performance.
For example, if the recent performance is below the historical, it displays a negative variance.
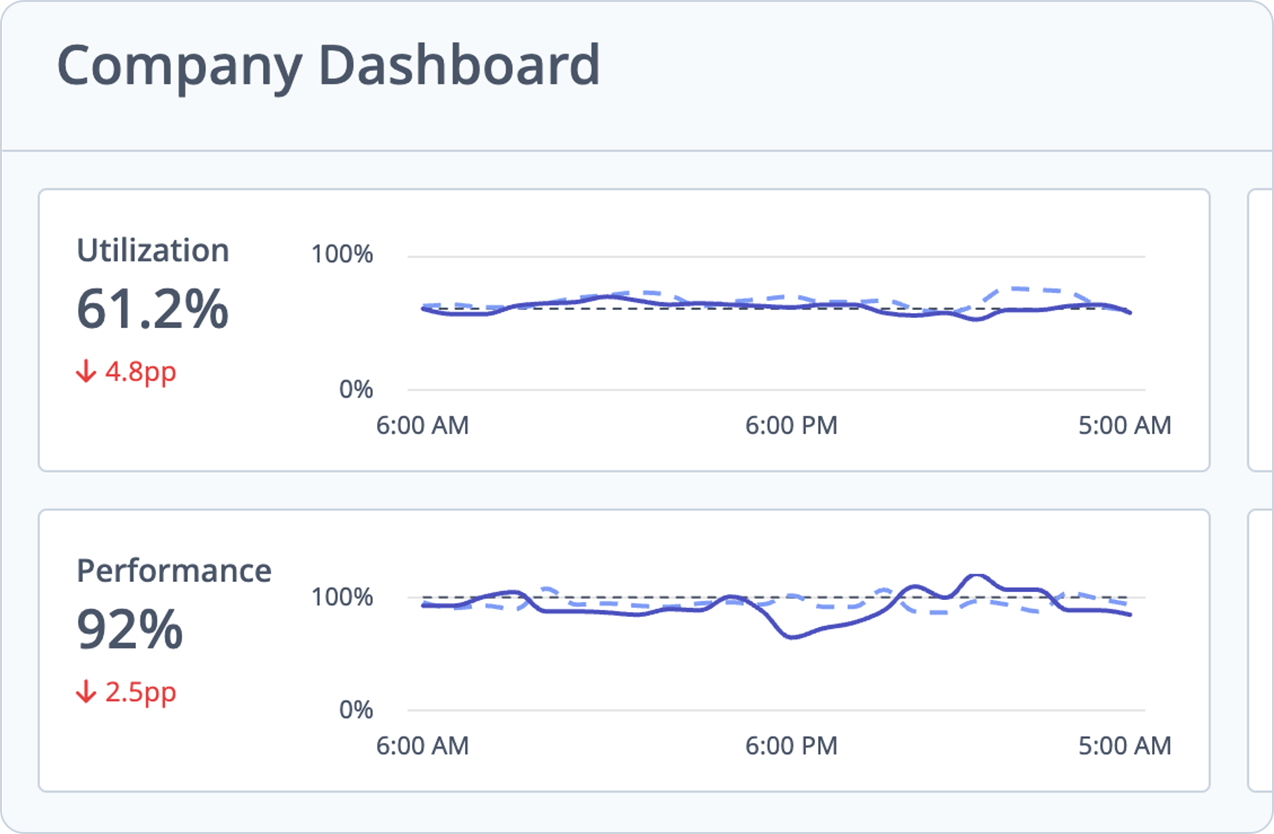
This functionality’s use of real-time data means that benchmarking is dynamic and constantly updating across all tracked metrics.
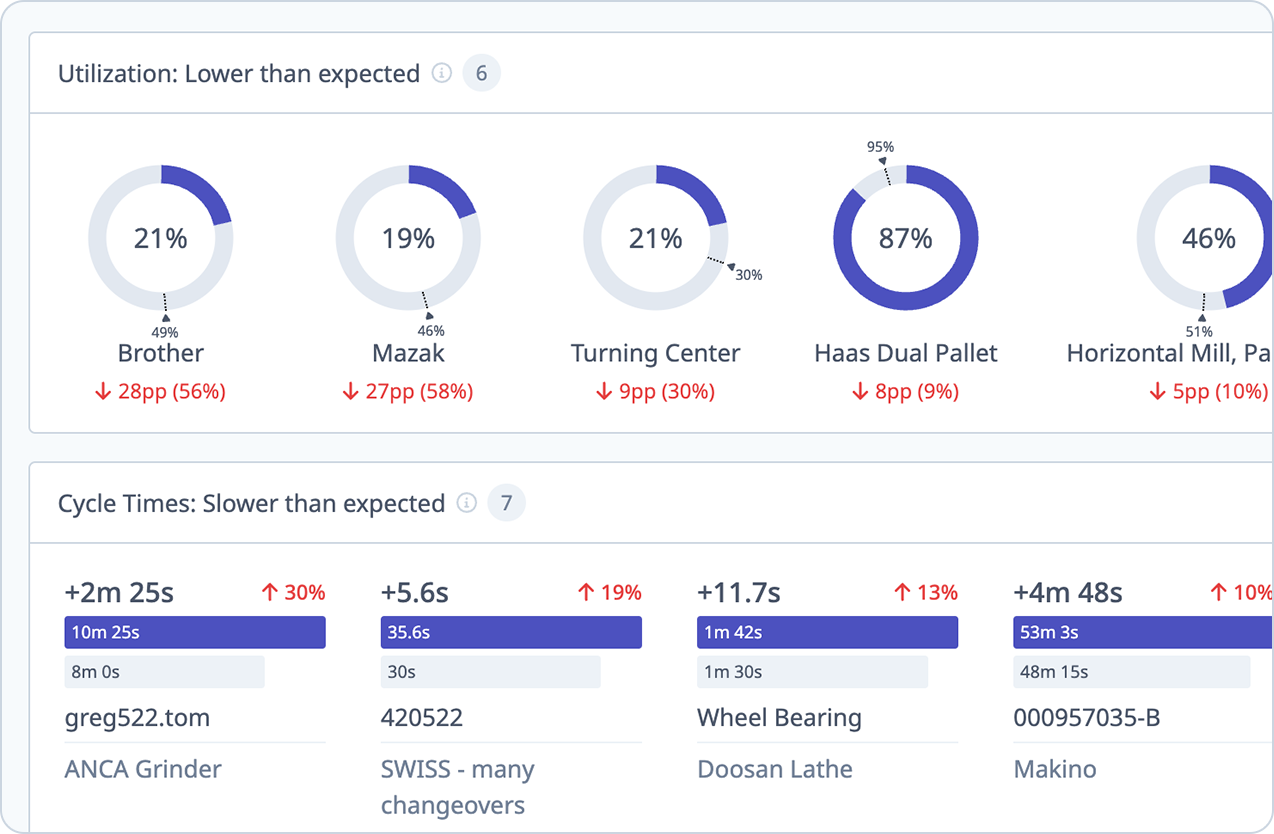
A unique aspect of the MachineMetrics benchmarking function is its ability to call out underperforming machines so teams can take immediate action. You can zero in on utilization, cycle times, OEE, availability, and other data to understand what to tackle first. As users drill down into the dashboard, they can find the root cause of any variances.
For example, on the company dashboard, MachineMetrics highlights the machines that are performing far below expected performance (based on utilization) as well as the jobs that have a cycle time slower than expected.
One MachineMetrics partner, Mayville Engineering Company, shifted from manual data capture to the MachineMetrics platform. The raw data analyzed by the platform immediately enabled MEC to gain visibility over key performance and begin to improve on their existing baseline.
The results were a 10-15% improvement in uptime and a 15-20% efficiency gain.
In another example, Wiscon Products’ deployment of MachineMetrics allowed them to determine which parts exceeding established production goals gave them market opportunities. They used benchmarked data to identify problems and fix errors in quoting, processes, and training. The result was a 30% increase in machine utilization and a 48% increase in operator efficiency.
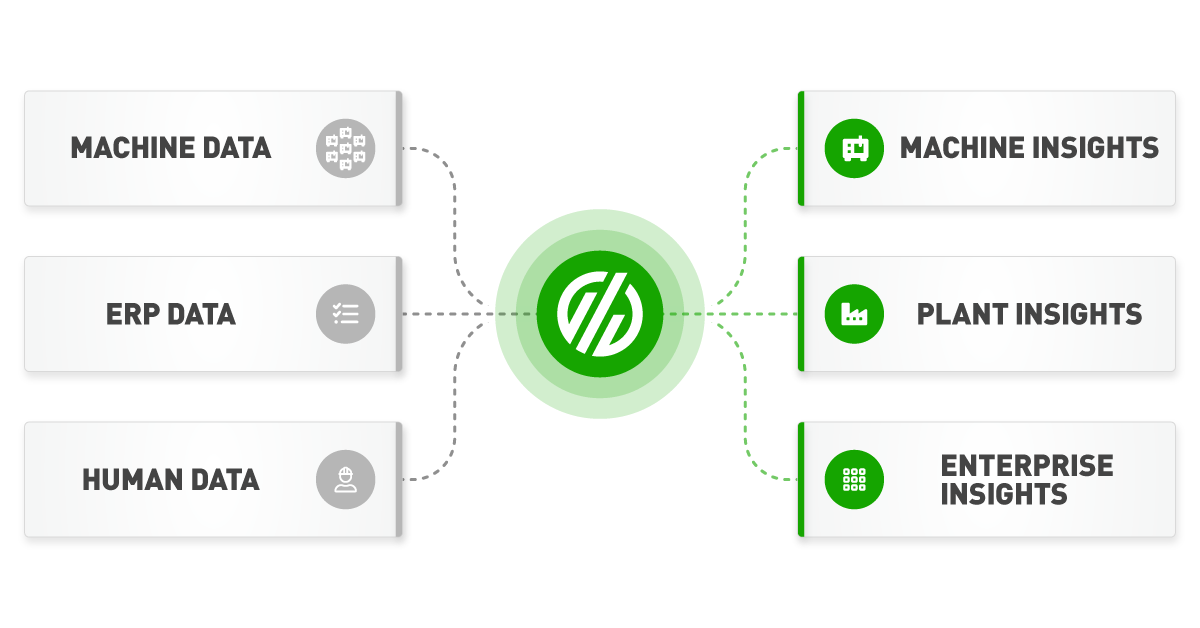
Levels of Benchmarking: Machine, Plant, and Enterprise
Because real-time data and analytics allow you to zoom in for a granular view or out for a holistic or global view, many types of benchmarking metrics can be accessed in the MachineMetrics platform. These metrics can be reviewed over various periods, such as daily, weekly, monthly, etc.
Enterprise Level
Using MachineMetrics’ data to review baselines at the enterprise level lets executives adjust and fine-tune performance across multiple facilities. If the performance of one plant is outpacing another, they can decide to shift orders to the facility with existing capacity.
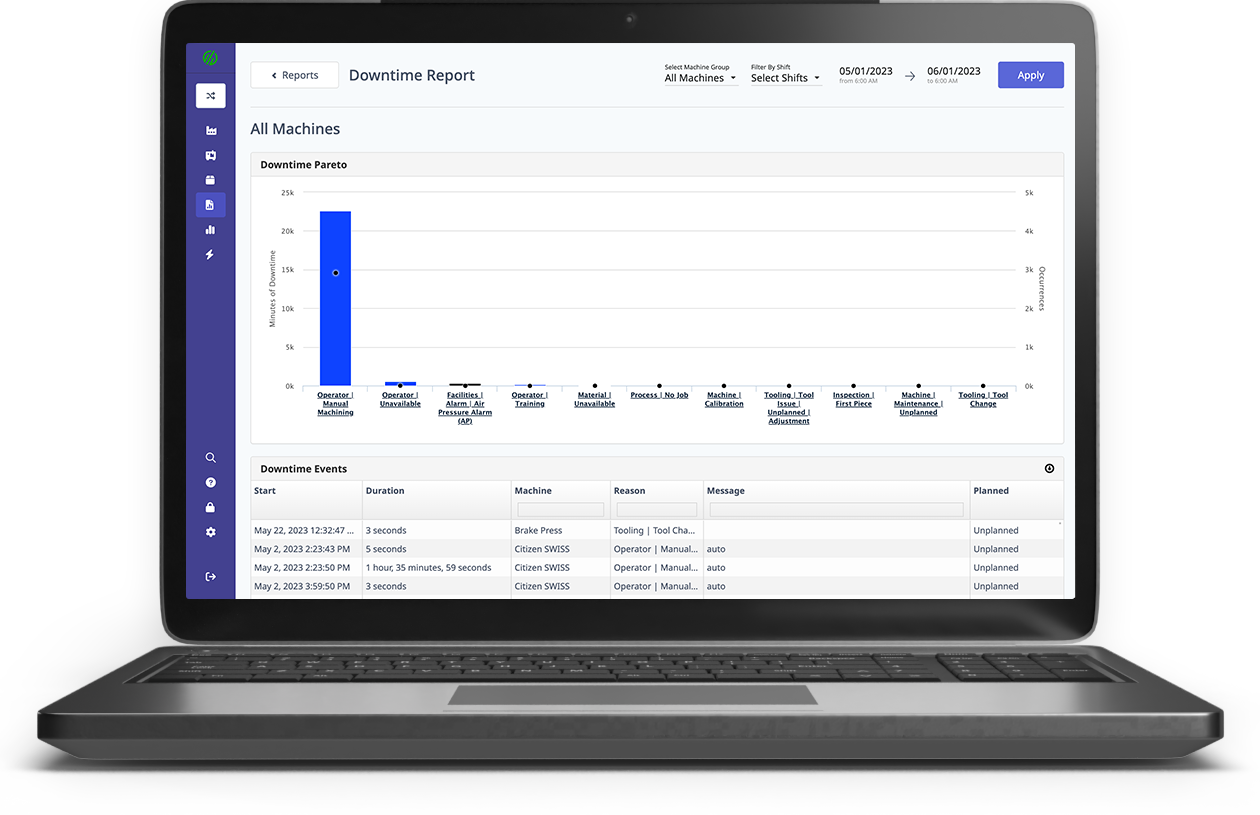
Likewise, they can drill down to understand differences in product mix to adjust processes or balance the job types to smooth the balance between more straightforward and more complex runs. When Paragon Medical’s vast array of OEM and legacy assets made analysis complex, they found they lacked control over enterprise-level problems.
Using real-time dashboards, Pareto charts for downtime, and utilization reports, Paragon identified issues across the enterprise to realize an astounding 140% increase in machine utilization.
Plant Level
At the factory level, front-line managers can use benchmarking to understand how the shop floor is performing. The system is always current because data is continually updated and added to the median calculations. By accessing this information from the company dashboard and other reports, users can identify machines and operators performing below the benchmark for that machine or shift.
The baseline data allows everyone to speak the same language because everyone has access to the benchmark metrics and views that apply to their jobs.
Operators can contextualize information that managers need to address regarding process issues and bottlenecks. And execs can leverage the dynamic nature of the benchmark data to shift assets and strategies as needed.
Machine Level
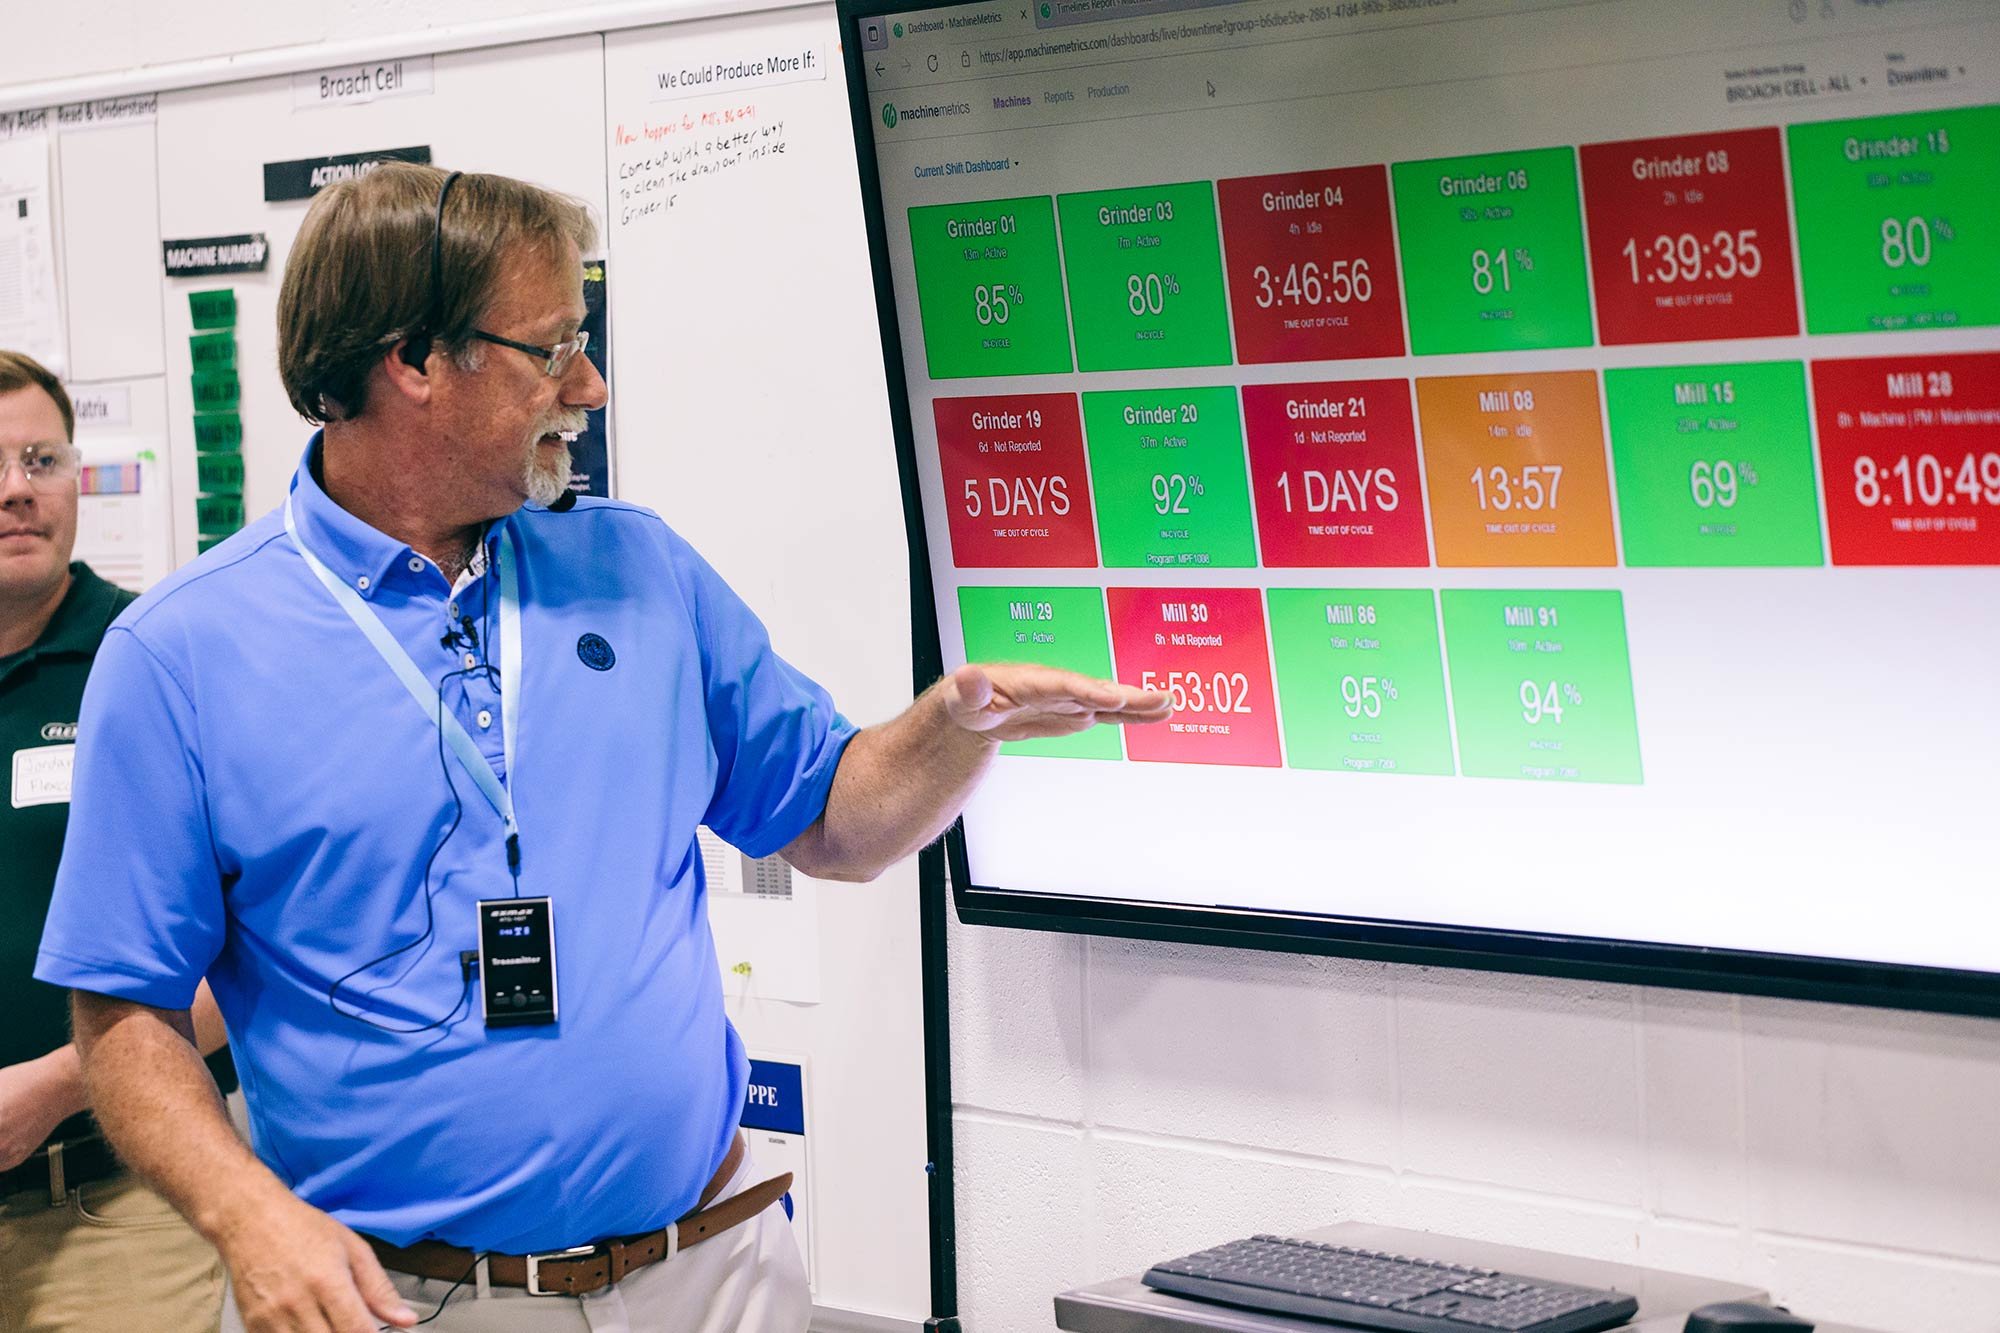
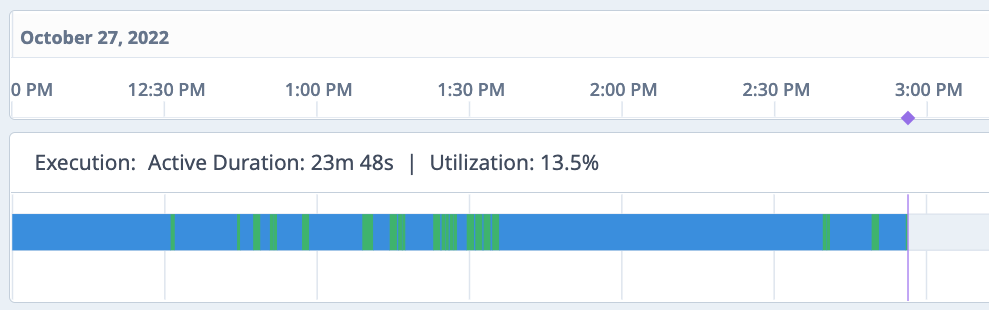
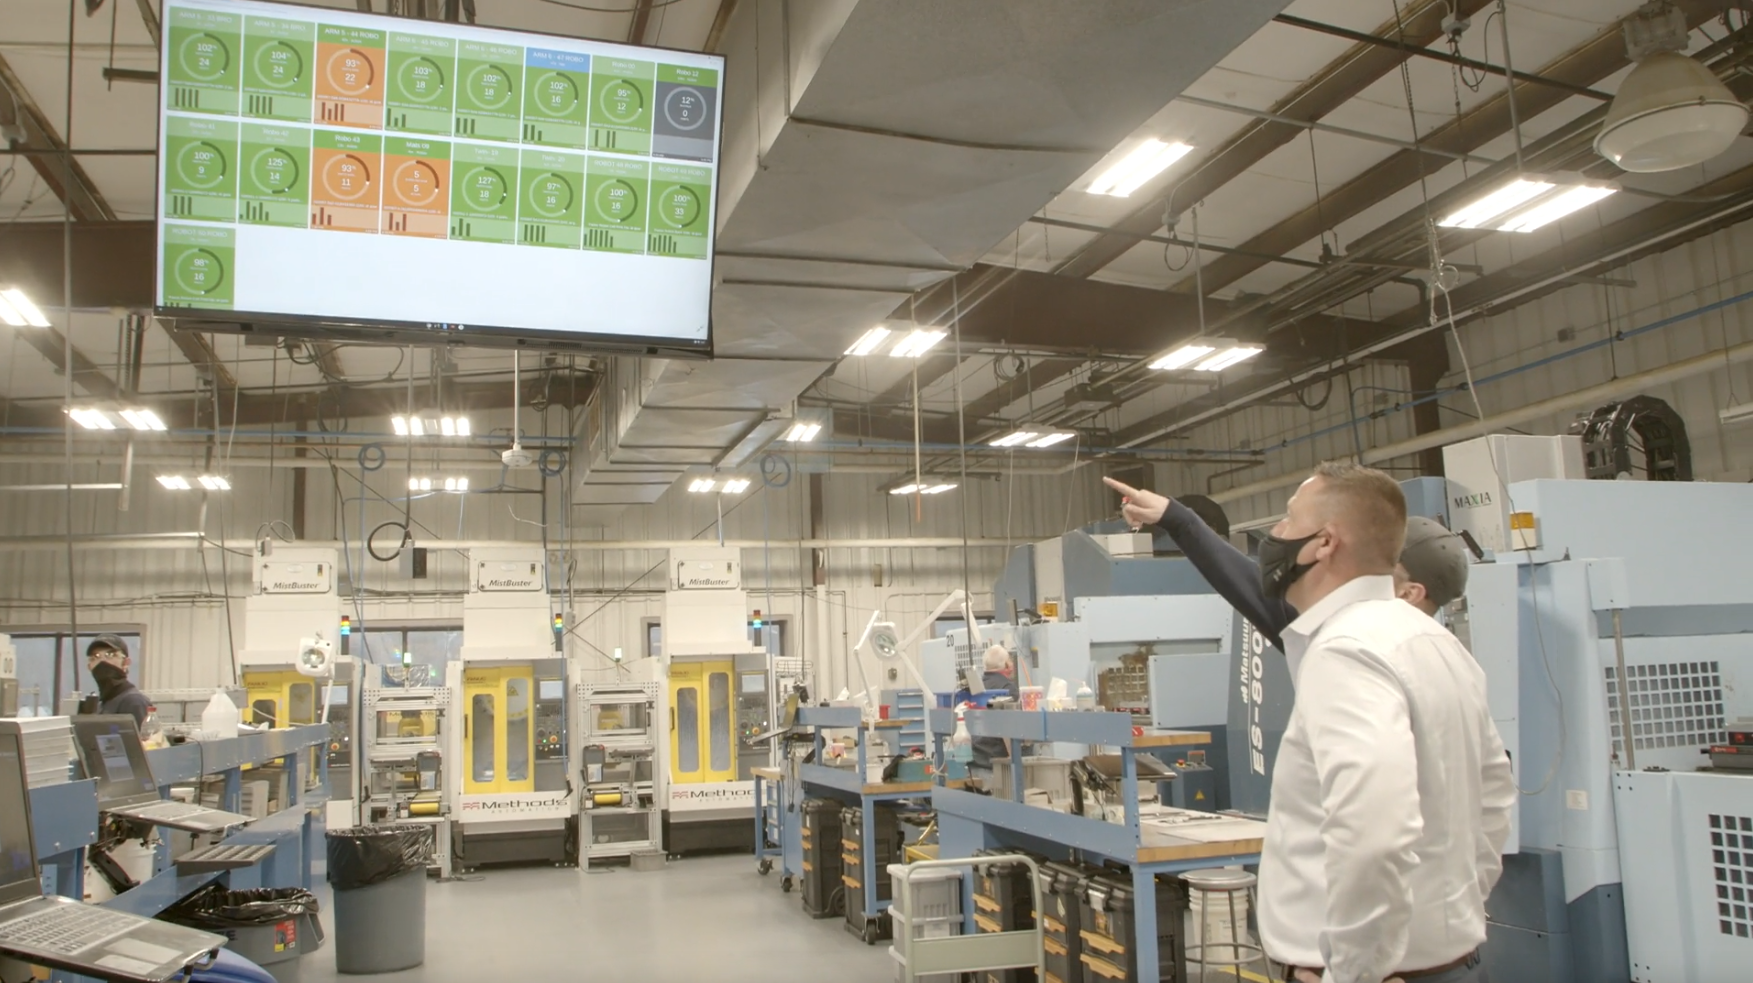
Operators, too, have access to this visibility. They can immediately see if they are on track to hit production targets and part counts for the day.
Simple color-coded (red/green) performance indicators on tablets at the machine, as well as dashboards above te shop floor, allow them to see where they are and how far ahead, or behind, they are on specific parts.
With real-time benchmark data, they can understand what underperforming machines they manage, as well as enable them to take corrective action.
Leverage Real-Time Baselines for Higher Performance
Knowing your performance in real-time is crucial to improving performance. MachineMetrics’ benchmarking capabilities give you the ability to understand performance from the enterprise level all the way down to each individual machine and operation.
With real-time data continuously updated with historical data, you will have a genuinely dynamic tool that lets you address bottlenecks, identify trends and patterns for process improvement, and drive data-driven insights on a daily basis.
Want to See the Platform in Action?
.svg)


Comments