


President
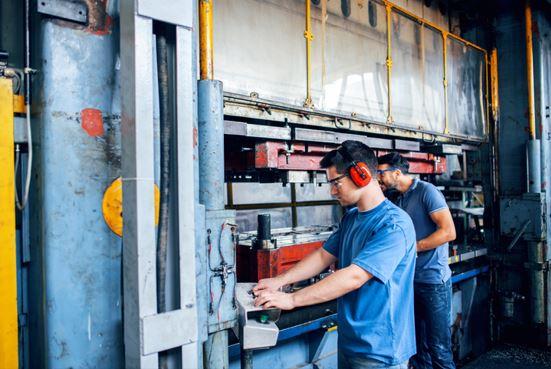
For metal forming companies to make the most of analytical technology, they will need skilled plant employees to share in leadership of the analytical processes. bluecinema/E+
Correlation analysis is a powerful tool for identifying relationships among conditions, events, and outcomes in a sheet metal forming facility. A correlation between two quantifiable variables can help determine the cause of an outcome or event. While the correlation itself doesn’t represent a cause/effect relationship, it offers a first step when troubleshooting problems.
The three core elements of reliable analysis are:
Conducting analysis without understanding the equipment, process, and materials could lead to destructive decisions that put employee safety at risk. Knowledge of all aspects of the shop floor is critical to the selection of a correct representative population and proper application of mathematics. For this reason, plant employee participation and understanding of the vocabulary, opportunities, and risks of statistical analysis must be part of any smart manufacturing development project.
Correlation is a measure of a potential relationship between two quantifiable and objective variables. Analysts express correlation as a numerical value, r, and sometimes they use a percentage:
-1 ≤ r ≤ 1 or -100% ≤ r ≤ 100%
A correlation value of -1 represents a strong negative correlation (as one value increases, the other decreases). A correlation value of 1 represents a strong positive correlation (as one value increases, the other increases). A value of 0 means there is no correlation between the variables. For values that fall between 0 and -1 or 0 and 1, the strength of their correlation increases as they approach either -1 or 1.
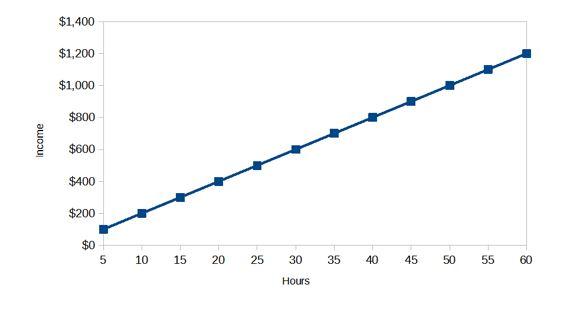
For example, let’s assume an employee receives a flat salary of $20/hour. Plotting the hours worked against income received shows a strong positive correlation between those two variables (see Figure 1). For this example, there is a cause/effect relationship, but most graphs will not be so obviously linear. Data points may be scattered in a generally linear pattern or scattered with no discernible pattern across the graph. A competent data analyst will be able to explain the results and their meaning.
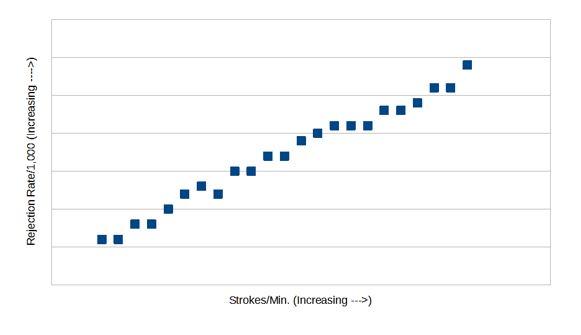
In a more challenging case, let’s try to identify a relationship between forming press strokes per minute and rejection rates. As shown in Figure 2, the rate of failure increases as the stroke rate increases, so we assume that an increase in stroke rate causes an increase in rejection rate. But what if the stroke rate only contributes to another weakness that causes failure? What if it’s just a coincidental correlation with no real relationship?
This is where understanding the materials and equipment used to form the component becomes critical. With this knowledge, the investigator should develop a short list of possible failure causes given the failure mode. In this case, possible causes may include:
Failure modes and effects analysis (FMEA) is an inductive process that helps investigators identify how failure modes of system components can cause system performance issues and develop safeguards against those failure modes. FMEA works hand-in-hand with statistical analysis to support investigation into root causes and to identify and document failure modes and effects as they occur.
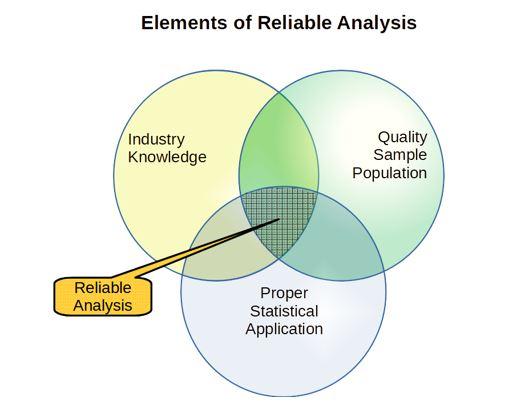
Industry knowledge, a quality sample population, and proper statistical application—all lead to reliable analysis.
Correlation analysis can be a valuable tool for finding historical evidence of the effect of failure events on a system. Correlation can confirm assumptions and identify potential new effects of identified issues. Again, this requires both deep understanding of your components and systems, as well as strong analytical skills.
The science of forming sheet metal has a distinct vocabulary and many interrelated variables. Likewise, the science of statistical analysis has its own vocabulary. Analytical technology will continue to become increasingly important to plant decision-making. This reliance demands that skilled plant employees share leadership in the analytical processes that will help direct operations. As experts in tool and die design, forming operations, equipment, and safety, we must all play a role in protecting the integrity of data and the reliability of analytical reporting.

The Fabricator is North America's leading magazine for the metal forming and fabricating industry. The magazine delivers the news, technical articles, and case histories that enable fabricators to do their jobs more efficiently. The Fabricator has served the industry since 1970.
start your free subscription


Easily access valuable industry resources now with full access to the digital edition of The Fabricator.

Easily access valuable industry resources now with full access to the digital edition of The Welder.

Easily access valuable industry resources now with full access to the digital edition of The Tube and Pipe Journal.

Easily access valuable industry resources now with full access to the digital edition of The Fabricator en Español.
In this episode of The Fabricator Podcast, Caleb Chamberlain, co-founder and CEO of OSH Cut, discusses his company’s...


