
When Evaluating Gage Stability, a Picture Says 1,000 Words
Gage capability programs can help analyze the cause of stability problems, but it can be revealing to manually sketch out histogram data to get a pictorial view of what is happening.


When measuring multiple parts and the results are showing unacceptable variation, it is important to understand whether the manufacturing or the measuring process is at fault. If measurement accuracy is relied upon, one may be tempted to adjust a manufacturing process that is, in reality, accurate and under control.
Gage stability implies different things in different contexts. If taken literally, it may refer to whether something is loose on the gage, or it can also mean some other gage problem occurs randomly to cause two identical trials to produce different results. There are many gage capability programs available to help analyze where the stability problems may be coming from. But it can be revealing to manually sketch out histogram data to get a pictorial view of what is happening. When plotted on a histogram, this type of instability often shows up as a distortion of the expected, normal bell-curve shape, many times in the form of dual modes (for example, two high points) with a dip in-between or in a node that is skewed toward one end of the tolerance range or the other.


Other types of stability are best assessed and visualized through plotting results in control charts, in which measurements of several small lots, each represented by a histogram, are compared over a period of time. A single, certified master or other qualified part should be used for the entire series of repeated trials. This eliminates part-to-part error as a variable, so the remaining variation will likely be low. Nevertheless, testing may show that variation between lots becomes significant enough over an extended period to constitute a measurement problem.
Statistical stability refers to the consistency of the measuring system’s performance from lot to lot. If a gage is statistically stable, each lot or histogram will be nearly identical in shape and range (R), and the average value (X-bar) of subsequent lots will be close to one another. If it is statistically unstable, the histograms will vary in terms of their X-bar, R values or both.
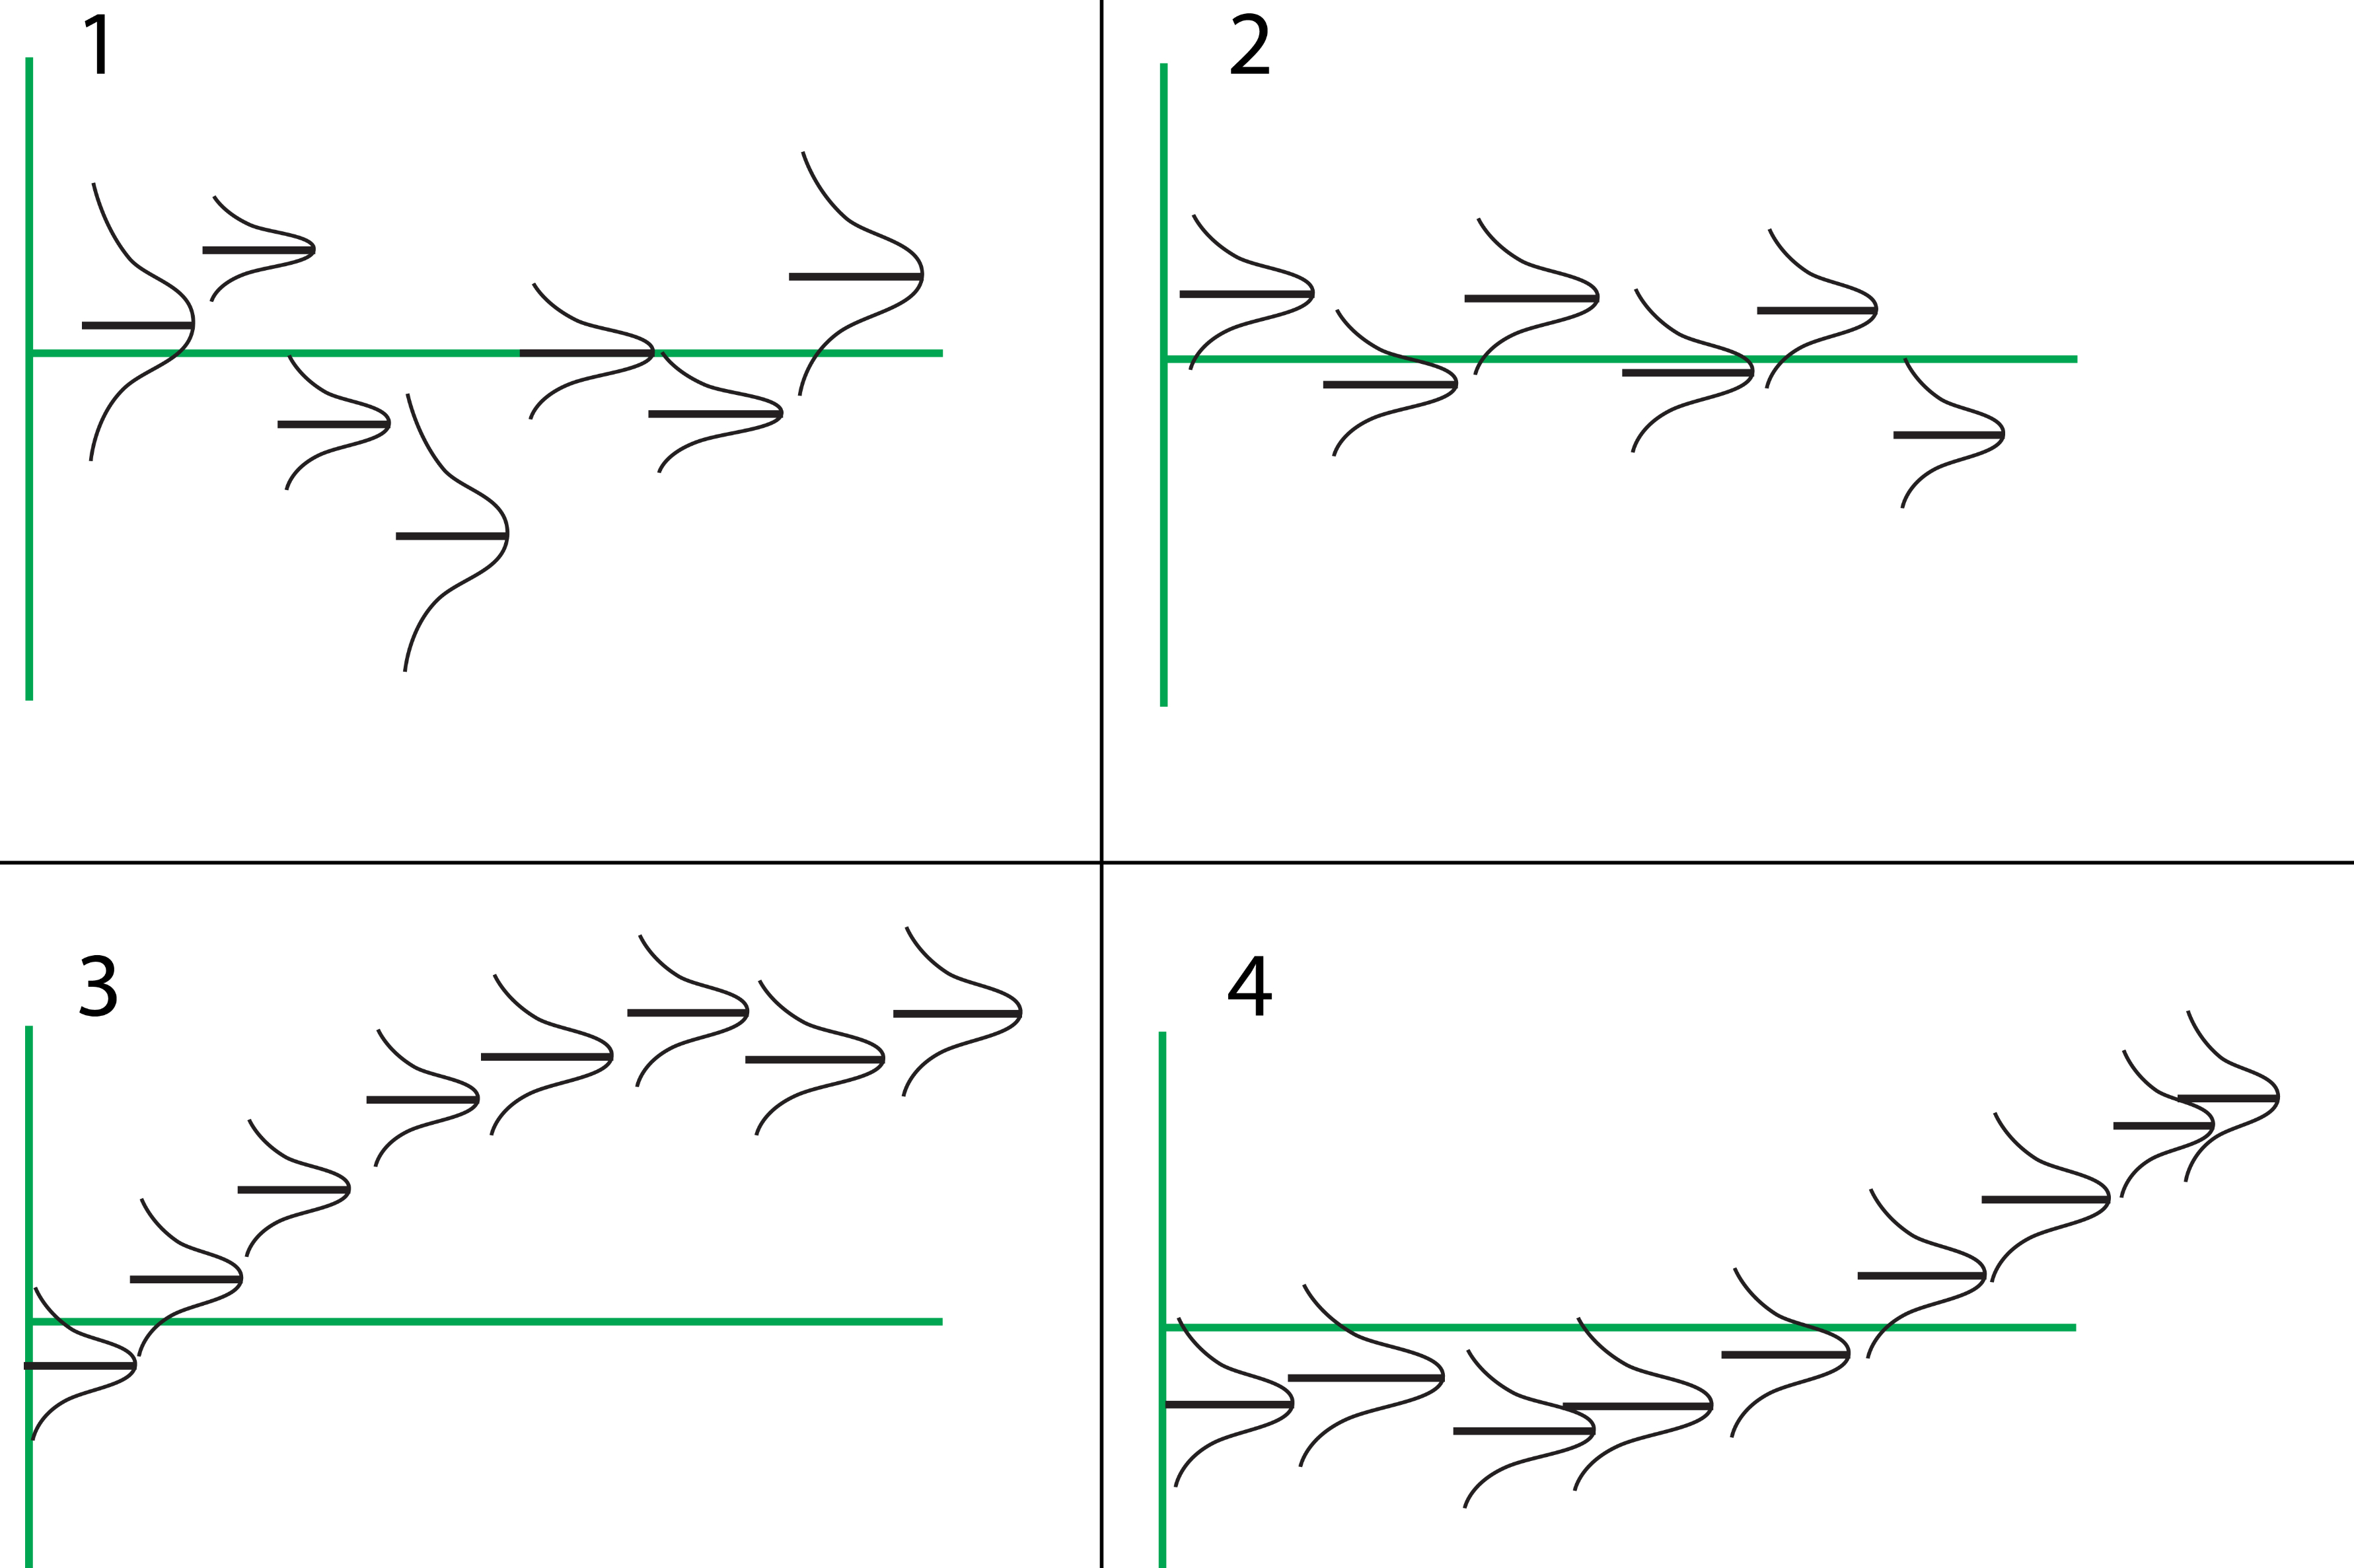
Figure 1 shows statistical instability of both sorts. The histograms vary consistently in their ranges and shapes, while the mean dimensions are clearly irregular from lot to lot.
Long- and short-term stability are confusing because both require a long-term effort to assess. In addition, both describe trends in the X-bar or R values across multiple lots. If we were to draw a line connecting the X-bar value of each histogram in Figure l, we would observe no clear trend. Thus, we cannot make a meaningful assessment of either long- or short-term stability.
In Figure 2, the R values are nearly identical, and the X-bar values are grouped much more closely, so the gage is statistically stable. A line connecting the X-bar values would show a clear trend along the nominal value, so we have good long-term stability. This chart shows realistically how the performance of a stable gage looks.
Figures 3 and 4 both show good statistical stability, but in Figure 3, there is a short-term stability problem with a bias in the plus direction. After a few sets of trials, however, the measurements become stable and remain so over the long term. The problem may be due to a warm-up condition in the gage itself or contamination that has settled on the gage overnight. The X-bar value shifts as the contaminant is dispersed due to mechanical interaction between the gage and the samples being measured. After a few dozen trials, all the contaminant is dispersed, and the measurements become stable.
Figure 4 illustrates the opposite situation. The gage is stable on startup and over the short term, but becomes unstable over the long term as the X-bar values drift upward. This might be the result of external thermal influences. If performance were to be charted over a longer period, the X-bar values might drift back toward nominal again; this would likely indicate the gage is responding as the plant warms up in the morning, then cools down toward evening.
It is important to check gages for stability to avoid making inappropriate adjustments to the manufacturing process. In some cases, solving the problem may be as simple as establishing a more frequent schedule for remastering the gage. In others, it could require a reevaluation of the entire gaging process. But in all cases, plotting the data to get visual results can paint a clear picture.


Related Content

Choosing the Correct Gage Type for Groove Inspection
Grooves play a critical functional role for seal rings and retainer rings, so good gaging practices are a must.
Read More
What Should Machinists Know About In-Machine Probing?
In-machine probing doesn’t reach the power of CMMs but can still be useful for pre- and mid-process control, as well as for “rough screening” of parts.
Read More
4 Ways to Establish Machine Accuracy
Understanding all the things that contribute to a machine’s full potential accuracy will inform what to prioritize when fine-tuning the machine.
Read More
How to Choose the Right Cut Off When Measuring Roughness
Measurement results for surface finishing parameters can vary depending on the filter parameter (Lc), also known as the cutoff.
Read MoreRead Next

The Cut Scene: The Finer Details of Large-Format Machining
Small details and features can have an outsized impact on large parts, such as Barbco’s collapsible utility drill head.
Read More
3 Mistakes That Cause CNC Programs to Fail
Despite enhancements to manufacturing technology, there are still issues today that can cause programs to fail. These failures can cause lost time, scrapped parts, damaged machines and even injured operators.
Read More
