Manufacturers, from those in the continuous process industries to discrete parts and batch production, are increasingly reliant on sensors and sensor data for safety, efficiency and quality. Inevitably, this proliferation creates challenges. Data is only useful when it becomes actionable information. How do engineering, operations and maintenance functions achieve this when the volume is growing exponentially?
This blog looks at the role of data collection sensors in modern manufacturing and how that data is stored and acted on. Focusing on sensors that can support machine and equipment maintenance, it considers the role of sensor data analytics in guiding decisions affecting machine lifetime, reliability and availability.
What is sensor data?
In the steam era an engineer would watch a pressure gauge to understand whether his locomotive was ready to work. This pressure gauge displayed sensor data, albeit in an instantaneous and analog form.
Sensor data is any signal output from a sensor. It’s a measurement of a physical parameter that can be used for decision-making. A thermometer measures temperature and displays the value. A tachometer measures and displays rotational speed.
For a long time, sensor data was analog and instantaneous. Today much of it, especially in industrial settings, is digital. For most sensors, this requires an analog-to-digital converter (ADC), usually integrated with the sensor itself. Once the data is in digital form it can be transmitted, stored and analyzed as needed.
Sensor data collection
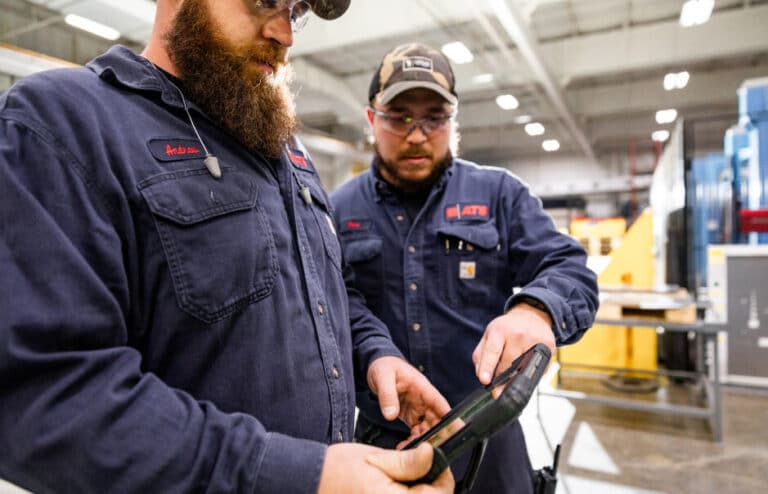
In manufacturing, data is essential for process control and optimization and productivity and efficiency improvement. This data comes from sensors installed on the equipment to measure critical parameters such as temperature, vibration and pressure. Increasingly, these are also being used for machine condition monitoring that enables predictive maintenance.
The Industrial Internet of Things (IIoT) has enabled a major advance in sensor collection. Today, sensors can be fitted with communications hardware and protocols that simplify data capture and send it to a central location virtually instantaneously. The main communications technologies used are:
- Modbus: A serial communication method supporting RS-232 and RS-485, widely used in supervisory control and data acquisition (SCADA) environments.
- Profibus: Used extensively for capturing sensor data in industrial automation, this serial protocol supports RS-485.
- Industrial Ethernet: Uses proven hardware and software, can have some speed limitations.
- Bluetooth: A high speed, short range wireless communication technology for point-to-point applications.
- Zigbee: A low power, short range wireless communication protocol but capable of longer range with a mesh topology.
- Wi-Fi: Proven but can be unreliable in enclosed industrial environments.
- Cellular: Systems can range from 2G to 5G technology with differing speeds and costs. Used on large sites and in campus environments and for remote equipment.
One consequence of easy sensor data collection is that the volume of data is increasing rapidly. This makes it harder to store and analyze what is being gathered. Approaches to this problem include:
- Edge computing: Rather than transmitting the raw sensor data, it’s filtered and analyzed at the sensor with only exceptions or summaries being communicated.
- Cloud storage: Data is sent to off-site storage locations where it may also be analyzed.
- On-site storage: Data is held on a server on-site. This has the advantages of less lag and potentially fewer security vulnerabilities but can become expensive.
Sensor data examples
Every physical property — temperature, pressure, size, speed and more — can be sensed and values measured and communicated by the right sensor. When choosing between the many types of industrial sensors it’s important to consider resolution, along with parameters such as range, speed and size, as this determines the granularity of the data acquired.
The following examples illustrate how sensors are used in preventive maintenance.
Vibration
Rotating machinery like pumps, fans and motors usually has a characteristic vibration signature. Inexpensive accelerometers can measure this vibration in multiple axes and output data to an analysis instrument. Out-of-balance conditions, damage and bearing wear all result in a change in the signature. This can be used as a trigger for inspection and subsequent repair if deemed necessary.
Temperature
Elevated temperatures often signify problems such as increased friction or electrical resistance or abnormally high current draw. In electrical cabinets and other equipment, it can also mean airflow is insufficient for adequate cooling and lead to premature component failure.
Temperatures can be sensed at individual points by devices like thermocouples and RTDs and over areas and at a distance by thermal imaging cameras or optical pyrometers. This can give early warning of lubrication or other overheating problems while there’s time to make changes or repairs before any lasting damage is done.
Oil Condition
Lubrication is essential in practically all industrial machinery, but oil wears out and must be replaced periodically. As with cars, this is often scheduled on an elapsed time or usage basis, but to err on the side of caution, it means oil changes are performed more frequently than needed.
An oil quality sensor measures oil condition continuously, looking for contamination and/or changes in acidity or viscosity. Data can be transmitted in real-time or as binary on-off signal triggered by exceeding a threshold. Scheduling changes on the basis of oil condition reduces machine downtime and expenditure on lubricants.
Sensor data analysis
Data is not information. The raw data must be analyzed, reviewed and interpreted by some means. Sensor data processing can be done offline and manually, for example, by importing it into a spreadsheet, or it can be automated. Given the volumes of data becoming available with IIoT technology, automated processing is the only practical approach in most cases.
Automated processing can be done right at the sensor, using edge computing devices, or on a PC or server with appropriate analytical software. Increasingly, artificial intelligence (AI) and machine learning (ML) are being used for analysis as they can handle the data volumes and spot trends and patterns that would otherwise remain undetectable.
Time series data vs. sensor data
These two terms are sometimes used interchangeably, but they are different. Time series data is often displayed graphically with time as the x-axis. This is useful for showing trends over time and establishing correlations with other phenomena. For example, temperature rise as a function of how long an air filter has been in place.
Sensor data is the individual data points plotted on the time series graph. When sensor data is accumulated and associated with specific timestamps it becomes time series data. Without a timestamp, it is just an instantaneous value like that shown on the steam locomotive’s boiler pressure gauge.
Getting help putting sensor data to work
There was a time when data about processes or machine condition was hard to get, store and analyze. Today, especially with IIoT technology, the challenge has evolved to become one of how to store and analyze the vast quantities of data generated by sensors installed on machines and other equipment.
Along with edge computing, communication technologies and storage media such as the cloud and on-site servers provide manufacturers with a trove of sensor data relating to operational performance. With the aid of powerful analytic tools, this can be used for machine condition monitoring and predictive maintenance strategies.
For businesses taking advantage of such capabilities, the benefits include higher productivity, output and OEE, plus longer equipment life and, therefore, lower depreciation expense. For help developing and implementing advanced maintenance strategies such as those requiring machine condition monitoring, contact ATS.